Contour & Envoy 指标
本文档内容与Contour与 Envoy 的metrics相关, 据Contour与envoy的官网内容并参考源码、第三方blog等汇总而成. 因为 Contour 指标较少, 所以在文中全部列出,且个人主观的将其暂分为:必须与可选的; 在envoy中 metrics被称为stats 通过管理接口向公众暴露,因其指标过多,所以按官方建议只选取Cluster与HCM相关指标,并只抽取个人认为比较重要且现阶段需要的指标列出,如需要相看详情,请点击相应链接.
Contour 指标
| Required | Name | Type | Description | |
|---|---|---|---|---|
| YES | contour_build_info | Gauge | branch, revision, version | |
| NO | contour_cachehandler_onupdate_duration_seconds | Summary | Histogram for the runtime of xDS cache regeneration. | |
| YES | contour_dagrebuild_timestamp | Gauge | Timestamp of the last DAG rebuild. | |
| NO | contour_dagrebuild_total | Counter | Total number of times DAG has been rebuilt since startup | |
| YES | contour_eventhandler_operation_total | Counter | Total number of Kubernetes object changes Contour has received by operation and object kind. | |
| YES | contour_httpproxy | Gauge | Total number of HTTPProxies that exist regardless of status. | |
| NO | contour_httpproxy_invalid | Gauge | Total number of invalid HTTPProxies. | |
| NO | contour_httpproxy_orphaned | Gauge | Total number of orphaned HTTPProxies which have no root delegating to them. | |
| YES | contour_httpproxy_root | Gauge | Total number of root HTTPProxies. Note there will only be a single | |
| YES | contour_httpproxy_valid | Gauge | Total number of valid HTTPProxies. |
Envoy 指标
Cluster
General
| Name | Type | Description |
|---|---|---|
| cluster_added/modified/removed/updated | Counter | Total clusters added / modified / removed / updated |
| active_clusters | Gauge | Number of currently active (warmed) clusters |
| upstream_cx_total | Counter | Total connections |
| upstream_cx_active | Gauge | Total active connections |
| upstream_cx_connect_fail | Counter | Total connection failures |
| upstream_cx_connect_timeout | Counter | Total connection connect timeouts |
| upstream_cx_connect_ms | Histogram | Connection establishment milliseconds |
| upstream_cx_rx_bytes_total | Counter | Total received connection bytes |
| upstream_cx_tx_bytes_total | Counter | Total sent connection bytes |
| upstream_rq_total | Counter | Total requests |
| upstream_rq_active Gauge | Total | active requests |
| upstream_rq_timeout | Counter | Total requests that timed out waiting for a response |
| upstream_rq_retry | Counter | Total request retries |
| upstream_rq_retry_success | Counter | Total request retry successes |
Request Response Size statistics
| Name | Type | Description |
|---|---|---|
| upstream_rq_headers_size | Histogram | Request headers size in bytes per upstream |
| upstream_rq_body_size | Histogram | Request body size in bytes per upstream |
| upstream_rs_headers_size | Histogram | Response headers size in bytes per upstream |
| upstream_rs_body_size | Histogram | Response body size in bytes per upstream |
HCM
General
| Name | Type | Description |
|---|---|---|
| downstream_cx_total | Counter | Total connections |
| downstream_cx_active | Gauge | Total active connections |
| downstream_cx_rx_bytes_total | Counter | Total bytes received |
| downstream_cx_tx_bytes_total | Counter | Total bytes sent |
| downstream_rq_total | Counter | Total requests |
| downstream_rq_active | Gauge | Total active requests |
| downstream_rq_1/2/3/4/5xx | Counter | Total 1/2/3/4/5xx responses |
| downstream_rq_completed | Counter | Total requests that resulted in a response (e.g. does not include aborted requests) |
| downstream_rq_time | Histogram | Total time for request and response (milliseconds) |
Per user agent statistics
| Name | Type | Description |
|---|---|---|
| downstream_cx_total | Counter | Total connections |
| downstream_rq_total | Counter | Total requests |
HTTP per listener statistics
| Name | Type | Description |
|---|---|---|
| downstream_rq_completed | Counter | Total responses |
| downstream_rq_1/2/3/4/5xx | Counter | Total 1/2/3/4/5xx responses |
Tracing statistics
| Name | Type | Description |
|---|---|---|
| random_sampling | Counter | Total number of traceable decisions by random sampling |
| service_forced | Counter | Total number of traceable decisions by server runtime flag tracing.global_enabled |
| client_enabled | Counter | Total number of traceable decisions by request header x-envoy-force-trace |
| not_traceable | Counter | Total number of non-traceable decisions by request id |
| health_check | Counter | Total number of non-traceable decisions by health check |
参考
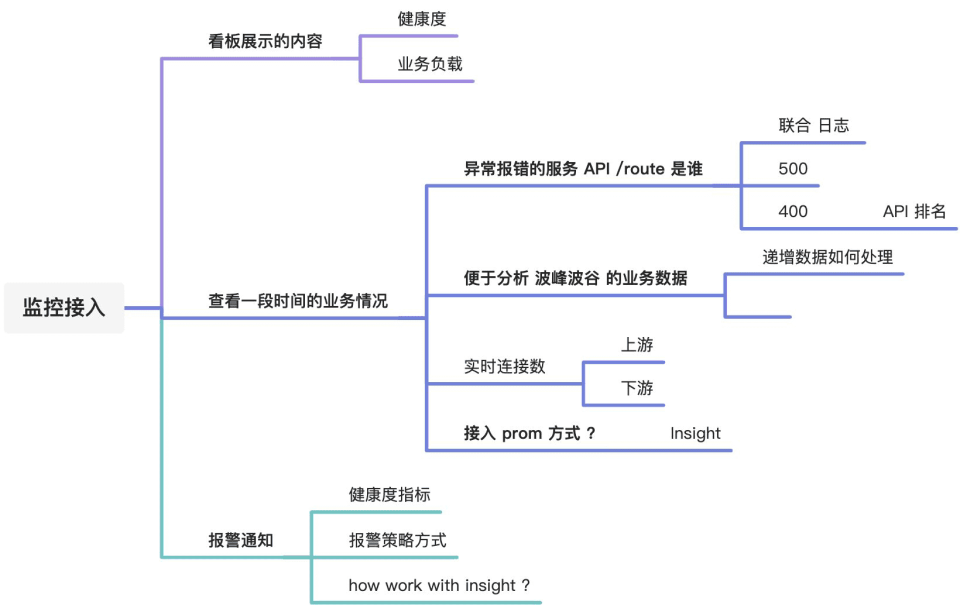
关于监控指标的问题答疑:
- 实时 启动之后一直有的
- 时间范围的数据
- 数据统计维度
- contour httpproxy count
- envoy request count
- httpproxy -> route -> request info summary
- 现阶段暂时未接入 prom,需要考虑如何处理,接入后会联动到 grafana,这部分跟 insight 怎么处理
- 告警怎么做?拿到了数据指标之后怎么处理